


Celerys ANALYZE
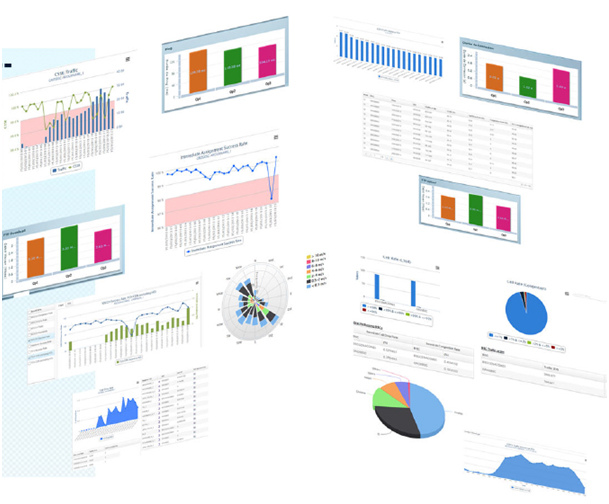
CELERYS ANALYZE provides a real-time visualization, analysis and reporting for the measurement performed by all CELERYS MOBILE, CELERYS Q-NET and CELERYS PROBE tools. It's a very scalable tool for unique and multi-operator benchmarking.
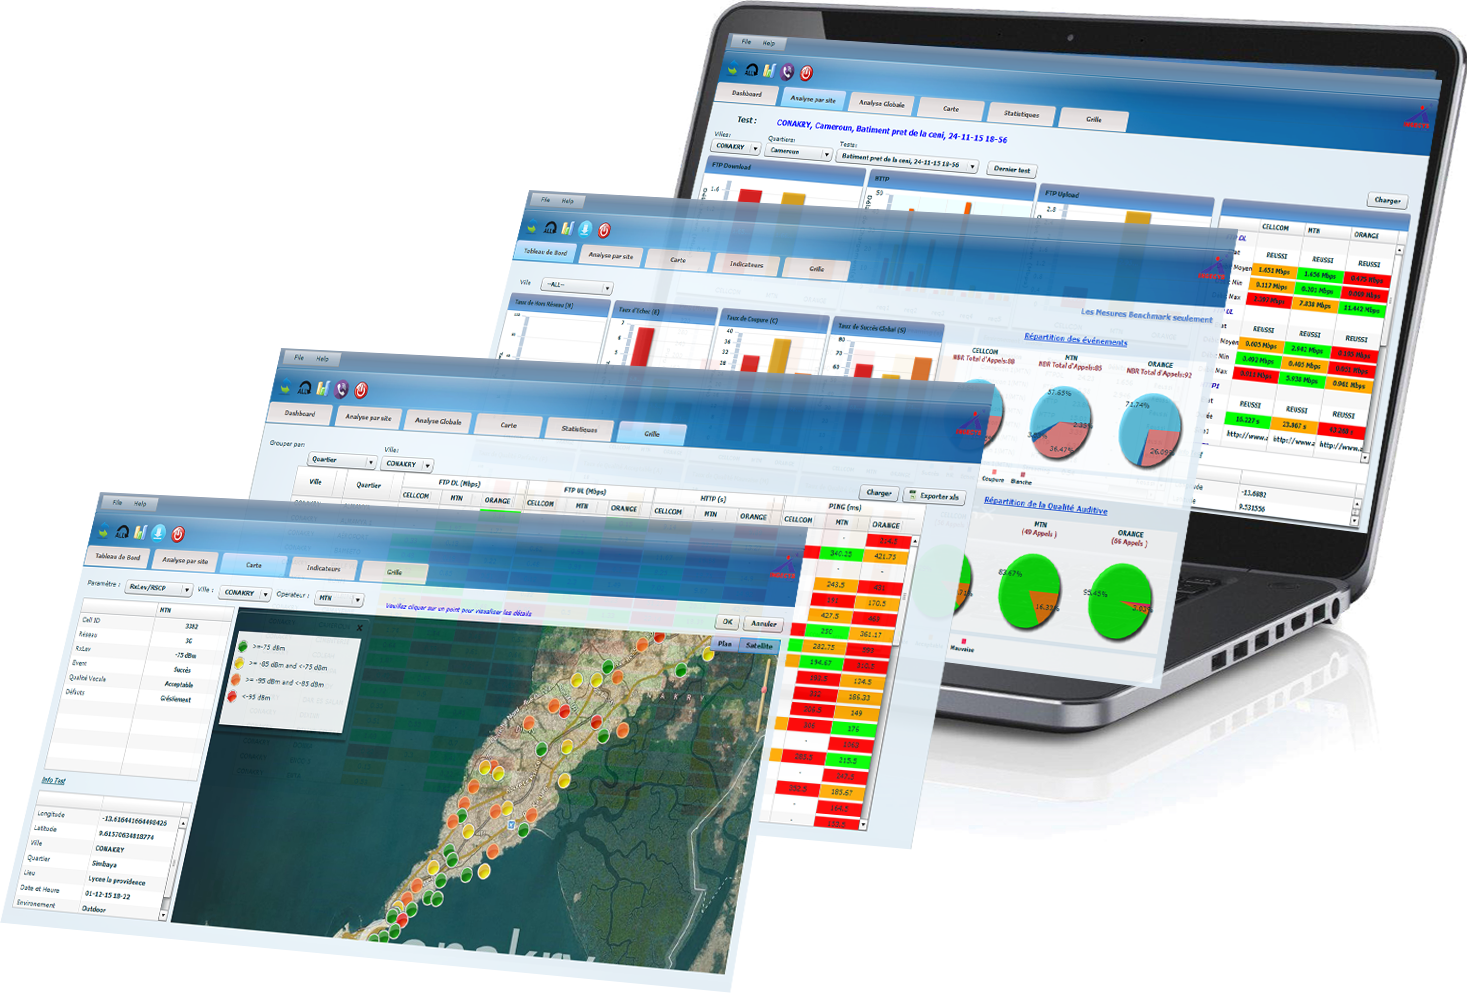
With its advanced features: real-time visualization, mapping management, advanced filtering in the dashboard and in KPIs calculation, site database correlation, raw data and results exporting and automatic post-processing and customized reporting, CELERYS ANALYZE is a powerful analysis tool for network QoE evaluation.
CELERYS ANALYZE support various network technologies including GSM/GPRS/EDGE, CDMA 1xRTT/EVDO, UMTS/HSPA/HSPA+, LTE/LTE-A, WIFI and WIMAX.
CELERYS ANALYZE is a powerful platform for QoE Benchmarking in a multi-operator environment. The user can analyze individual measurements or grouped measurements by city, by city area, by cluster, by RAN(2G/3G/4G), by region, by vendor, by busy hours, by measurement environment incar/indoor/outdoor/in-train...
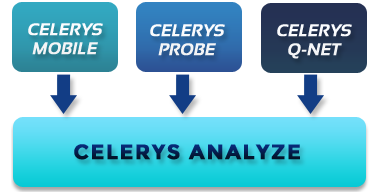
CELERYS ANALYZE supports all the measurement performed by CELERYS MOBILE, CELERYS PROBE and CELERYS Q-NET in one unique platform.
STRENGTHS
- QoE Voice and DATA analysis with a quick switch
- Real-time visualization, post-processing and customized reporting
- Generation of KPIs table with advanced filtering (by city, by area, by cluster, by region, by Location/Routing Area)with export to Excel facilities
- Ability to load all measurements data or only multi-operators data (Benchmark measurements)
- Very featured Mapping with low performance area analysis and site database correlation
- Real-time multi-operator Benchmark visualization
- QoE KPI calculation
- Other tools Drivetest visualization and correlation
Map tool analysis provides deep analysis with visualizing the details of the QoE results for each measurement; show the serving cell for the measurement and helps for troubleshooting. The analysis allows evaluating and comparison of the results between operators (in case of benchmarks) with colored ranking. The filter option allows the user to do analysis by city, by cluster, vu area, by region and by other predefined classes.
The dashboard tool can generate synthetic reports and easy evaluation of the performance of the network. The dashboard can be customized and automatically generated.